
| » Gene Expression | ||
| » DNA Sequencing | ||
| » Oligo Synthesis | ||
| » Biacore | ||
| » Protein Analytics | ||
|
||
| » Peptide Synthesis | ||
| » Mass Spectrometry | ||
Located in rooms
B065 and B017 |
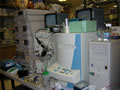
| Protein Analytics |
• DATA ANALYSIS |
Edman Sequencing (N-terminal or internal) (back to top)
Amino acid sequences are reported using single-letter code for the
twenty amino acids. For a variety of reasons, tryptophans, cysteines
and amino acid residues containing side-chain modifications will
generally be reported as blanks.
We often encounter samples containing mixtures of polypeptides. When the amino acid yields of two or more of the components of a mixture are similar, we may not be able to unambiguously order such sequences. In order to aid in the separation of mixed sequences, we provide a very approximate estimate of the picomole yield for each amino acid. However, the amino acids differ widely in their stability to Edman chemistry, so the given ordering may be misleading.
When mixed sequences represent gene-coded proteins, the correct ordering can often be deduced by reference to the known sequence. For de novo sequences, correctly ordering a mixture of proteins depends upon a clear difference in protein abundance between the components of the mixture. If more than are amino acid is identified at a given cycle the investigator should use caution in assigning a specific amino acid to that position in the sequence.
Mass Mapping (back to top)
We analyze protein mass maps by using one of a variety of search
engines available on the internet. These publicly available programs
perform a “best fit” mass analysis of the peptide map
in comparison with theoretical digests for those proteins that are
archived in one of the public databases. In general we use “Mascot”
for this purpose. (See URL below.)
For each sample analyzed we return a Result Summary page on which the best match is listed at the top and alternative matches are given in descending order of probability score. ProFound calculates the probability that a candidate protein is the correct match. For moderately good matches, an estimated Z score is reported. In general, a Z score of 1.65 or greater indicates a correct match; for further discussion the client should consult Profound directly at: http://129.85.19.192/profound_bin/WebProFound.exe?FORM=1
For most samples we also return a Detailed Results page. This page shows a map of the matching protein with the location of the presumptively matching peptides represented by horizontal bars. When we do not return a Result Details page it is because we consider the significance level of the best match to be too low to indicate the sample’s identity unambiguously. On the other hand, inclusion of a Result Details page does not imply that the match is conclusive. Again, the client should consult the Profound web page for further details.
It should be stressed that mass mapping generates inferential evidence of protein identity, as opposed to empirical protein sequence data that is generated, for example, by Edman degradation. The programs we use to match mass spectrometric profiles provide putative peptide sequence data corresponding to peptides from the matching protein. Please note that our analysis does not generate this sequence information.
Home | FAQs | | Prices | Contact Us | Publications | Feedback
Beckman Center | Stanford Medical Center | Stanford University
© 2006 Stanford PAN Facility. All rights reserved