| » Gene Expression | ||
| § DNA Sequencing | ||
|
||
| » Oligo Synthesis | ||
| » Biacore | ||
| » Protein Analytics | ||
| » Peptide Synthesis | ||
| » Mass Spectrometry | ||
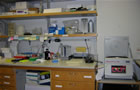
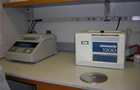
Located in rooms
B065 and B017 |
| DNA Sequencing |
• DATA ANALYSIS |
• Software Needed (top) You will need Aladdin Expander to uncompress
the Electropherogram file. The text files can be opend with any text/word software. |
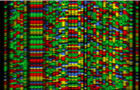
• Data Interpretation (top) At the completion of your sequence analysis, your data will be returned electronically as a text file and as an electropherogram. Additionally, a hard copy electropherogram can be picked up at B017, Beckman Center. When template quality and quantity are optimal, you should receive 600 - 700 bases of high quality sequence with an error rate of less than 1%. The appearance after first "N" (see below) in a sequence is a good indicator of high quality. Beyond 500 bases indicates a good run. The sequencer software designates a base "N" meaning "no call" when it is unable to call a base at a specific position. A visual inspection of the electropherogram may well allow the user to "overcall" the sequence. The location and frequency of these N values can be a strong indicator as to the quality of the sequence. If the first N is not observed within the first 500 bases, it is an indicator of high quality sequence. Once 4 or 5 N's have been encountered in a sequence, the sequence beyond the last n is normally of poor quality as the software is having difficulty distinguishing signal from noise. The major deviation from this N rule is when they occur within the first 50 bases of sequence. Under optimal circumstances, it should be possible to read clean sequence within 10 - 20 bases of the end of the primer. This is the earliest data recovered from the sequencing gel and the fragments run close to the dyefront of the gel. Any fluorescent material that is present in the reaction will also run at the dyefront and will tend to interfere with the early sequence data. Consequently, the presence of N's in this region is not uncommon and should not affect the quality of the subsequent sequence. |
What are the likely causes of poor quality sequence?
It is not uncommon for the sequence to die after long runs of poly A/T sequence due to the polymerase falling off the template DNA. Contact PAN for assistance. High G/C content does not appear to be a major problem for the newer cycle sequencing kits. Occasionally, template secondary structure can cause sequencing problems. Contact PAN for assistance
|
| Poor quality template - Remember, DNA sequencing is essentially an enzymatic reaction. The polymerase activity can be compromised by the presence of organics, salt, detergent or incorrect pH in the template solution. This will result in poor quality sequence data. We recommend Qiagen kits for template purification. |
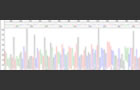
Too much or too little DNA - These are by for the most frequent causes for poor quality sequence. It is not uncommon to find that the quantity of template submitted is 3 - 10 fold less than requested. Remember, DNA sequencing is dependent upon the stoichiometry of primer to template. The longer the DNA fragment size, the greater the amount of DNA by weight that is required! In order to troubleshoot these kinds of problems, it is important to view the electropherogram output. The electropherogram is an electronic representation of the data
recovered from the sequencing gel. The x-axis represents time and
the y-axis represents relative signal intensity. The y-axis
is always scaled to the strongest signal strength and will change
from sample to sample. This means that even a blank lane will appear
to have some sequence data. The actual signal strength for each
reaction is presented as a numerical value and can be found on the
"signal" line of the electropherogram. The higher the number for
A, G, C, and T, the stronger the signal, the lower the numbers,
the weaker the signal. Values between 100 and 1000 represent the
optimal signal strength for good quality sequence. If the values
are above 1000, the sample probably contains too much DNA. This
can cause a merging or tailing of the sequencing bands and subsequent
loss of resolution. A 1 to 4 dilution of the template will normally
correct this problem. If the signal values are below 100, this normally
indicates too little DNA in the sample. This will result in short
read length (100 - 200 bases) before the signal merges with the
background noise. Alternatively, the sequence will start with a
strong clear signal and rapidly decline over 300 - 400 bases. Resubmitting
3 - 5 times more DNA will usually solve this problem. At times we
will add comments to your returned data in order to assist with
troubleshooting.
|
What are "top heavy" sequences? - This represents a special case. When a sample contains too much DNA all the trinucleotide pool will be used up within the first 100 bases or so and the sequence dies. This will often give "signal" values below 100 even though there is too much DNA. If we feel that this might be the case, we will indicate "top heavy" in the comments that accompany your data. Normally, we will rerun the samples at a 1 to 5 or 1 to 10 dilutions and see if the sequence quality improves. |
These comments are provided to assist you with interpretation of your data. They cover the most frequently encountered problems - but by no means all of them. Please contact us if you have additional questions -- our advice is always free!
Home | FAQs | | Prices | Contact Us | Publications | Feedback
Beckman Center | Stanford Medical Center | Stanford University
© 2006 Stanford PAN Facility. All rights reserved